
The Cropwalker - Volume 7 Issue 48

By Jonathan Zettler CPA, CMA, CCA-ON and Patrick Lynch CCA-ON
ALWAYS READ AND FOLLOW LABEL DIRECTIONS
CONFIDENTIAL NOT FOR PUBLICATION
Send us your questions
If you have a question, just reply to this email, we try to have an answer for you within 48 hrs. Or if you want an issue researched that is of general interest, contact us.
General
This is our last issue for the 2024 season. Thank you for reading. We will start publishing again in 2025 on the week of January 13th.
Things to Do This Week
1. Finish your holiday shopping
2. Update your Cost of Production. Understand three different scenarios for profitability. 1. Cash Flow Costs, 2) Accounting Costs 3) Economic Costs
3. Read your YEN report and make notes on what to change for the following growing season. Use the buddy system and go for a coffee or beer to review what you found by trading reports and critique each other’s results.
Cereals
Reading your Great Lakes Winter Wheat YEN Report (JZ)
I have been actively involved in promoting the Great Lakes YEN (Yield Enhancement Network) program since the pilot phase. The common question I get from people that have participated in the program is, lots of great data, now what? In my mind it’s the classic forest for the trees problem, with most report readers busy looking at the individual metrics or trees, and losing sight of how the report is trying to describe the forest or their wheat crop.
This is my 4th season having used the program, and here are a few pointers I have picked up over the years in looking at farmer participant reports.
You need to think like a crop physiologist when reading the report, and less like a farmer with a bottomless budget to spend. I say this lightheartedly, as you need to understand the key drivers in turning sunlight and water into yield, rather than just applying more crop nutrition or protection products to the crop. The top yielders in the program do tend to use more inputs than the rest of the pack, but there is more to the story than throwing money at a wall and hoping some of it sticks as wallpaper. The big rocks that make wheat yield are the number of heads, planting date, macro-nutrient fertility to drive sunlight into accumulated starch.
Things to look at on your YEN report – in order of priority (highest ROI to lowest ROI per unit of effort/$$$)
1. How many heads per square meter do you have? If it’s not over 700, why not? How many seeds are you dropping to get the heads you are getting? There is about 4047 square meter per acre, so if dropping 1.6 million seeds, then you are dropping 393 seeds per sq. meter. Say 650 heads per 393 seeds means 1.5 heads per seed. If every seed was viable, you have less than 1 tiller per plant. Normal from my experience is 2 to 2.5 heads per viable plant (1 to 1.5 tillers) when planted a week after the optimal seed date. If you’re below this 800 heads per sq m, need to dig into why you have such poor performance on the seed establishment. Usually, it’s related to drill maintenance and field setup, or perhaps your seed rate is too low for the date if past the optimal planting date and/or lack of in-furrow starter P.
2. Check Phosphorus values in soil, tissue, grain tests. P drives energy accumulation and helps to promote tillering. If low P testing soil and no starter P, expect to see reduced tillering and less thrifty plants, especially when planting is delayed.
3. Look at your Nitrogen tests, and grain protein results. Should be approaching 10% protein in SRW if you had optimal N rates for the yield potential. Above average yield potential may require higher N rates. Ideally spilt apply on growing crop ahead of light to moderate rain event.
4. Look at the N:S ratio, will provide an indication if enough S is being applied to meet protein formation. If S deficient, plants are not responsive to additional N, and higher rates will not increase yields.
5. What does your fungicide use look like relative to the other participants? If applying greater than 120 units of N/ac, you should likely be looking at 2 fungicide applications based on my experience. Even genetics rated “strong” for powdery mildew seem to have some infection in my area, and this is one leaf/stem disease you want to ensure you are managing. This disease will be more prevalent in high management stands due to reduced airflow.
6. Do you use a PGR? While not explicated stated in the report, if you are experiencing lodging at harvest, and have poor harvest index, there is some opportunity for you to improve your harvest index by keeping the crop standing. Potassium levels in the straw and plant tissue tests can also provide some feedback on how your fertility plan is performing if experiencing issues with lodging.
7. Finally, I would take a look at your tissue tests. Is there anything obvious that’s off the mark relative to the top participants or expected ranges? The one nutrient I focus on is Manganese. In some parts of the province, you may want to look at Magnesium.
If you haven’t signed up as of yet for the 2025 growing season and would like to participate, you can at the following link. https://greatlakesyen.com/how-to-participate/
PS – I have made a suggestion to the YEN steering committee that the reports in the future include a section on your field outliers, and maybe have the top 3-5 things to look at changing in your winter wheat production.
Soybeans
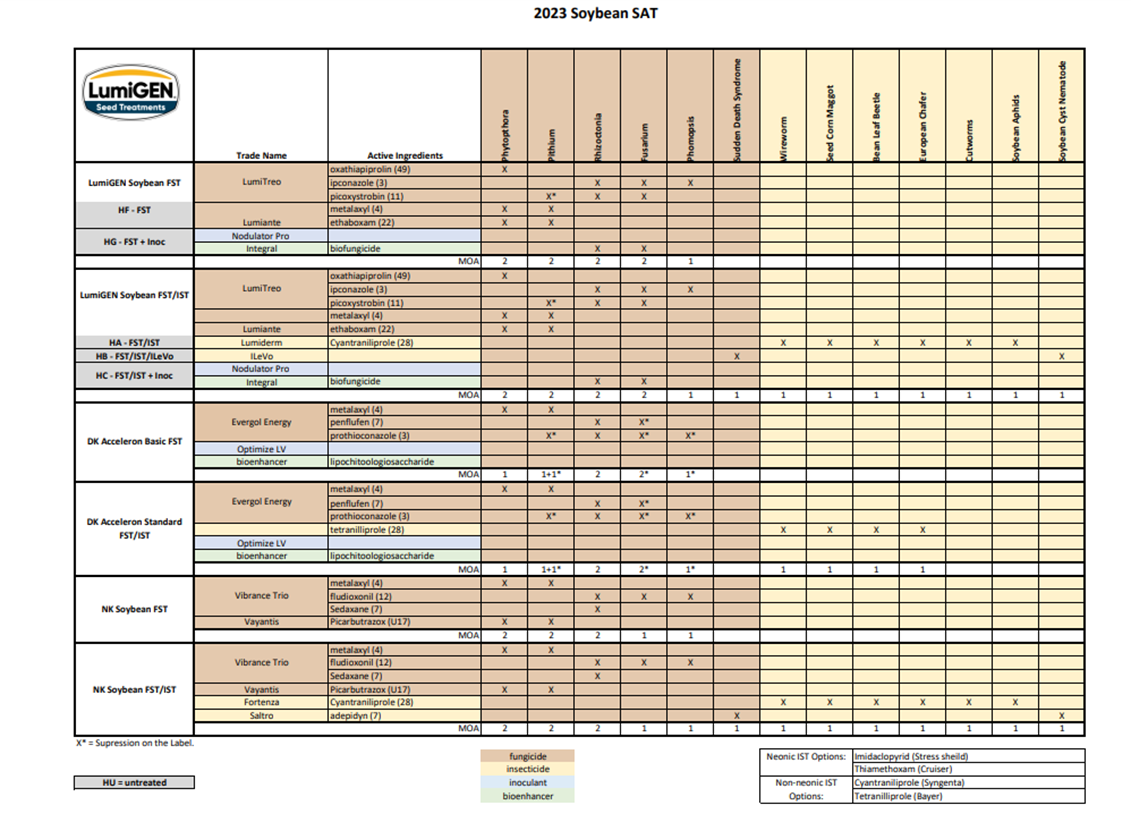
LumiGEN soybean seed treatment (PJL)
The following table shows you the new seed treatment from Corteva to help protect against phytophthora, which in some cases is killing up to 30% of soybean plants before 2 leaf stage on highly infected fields.
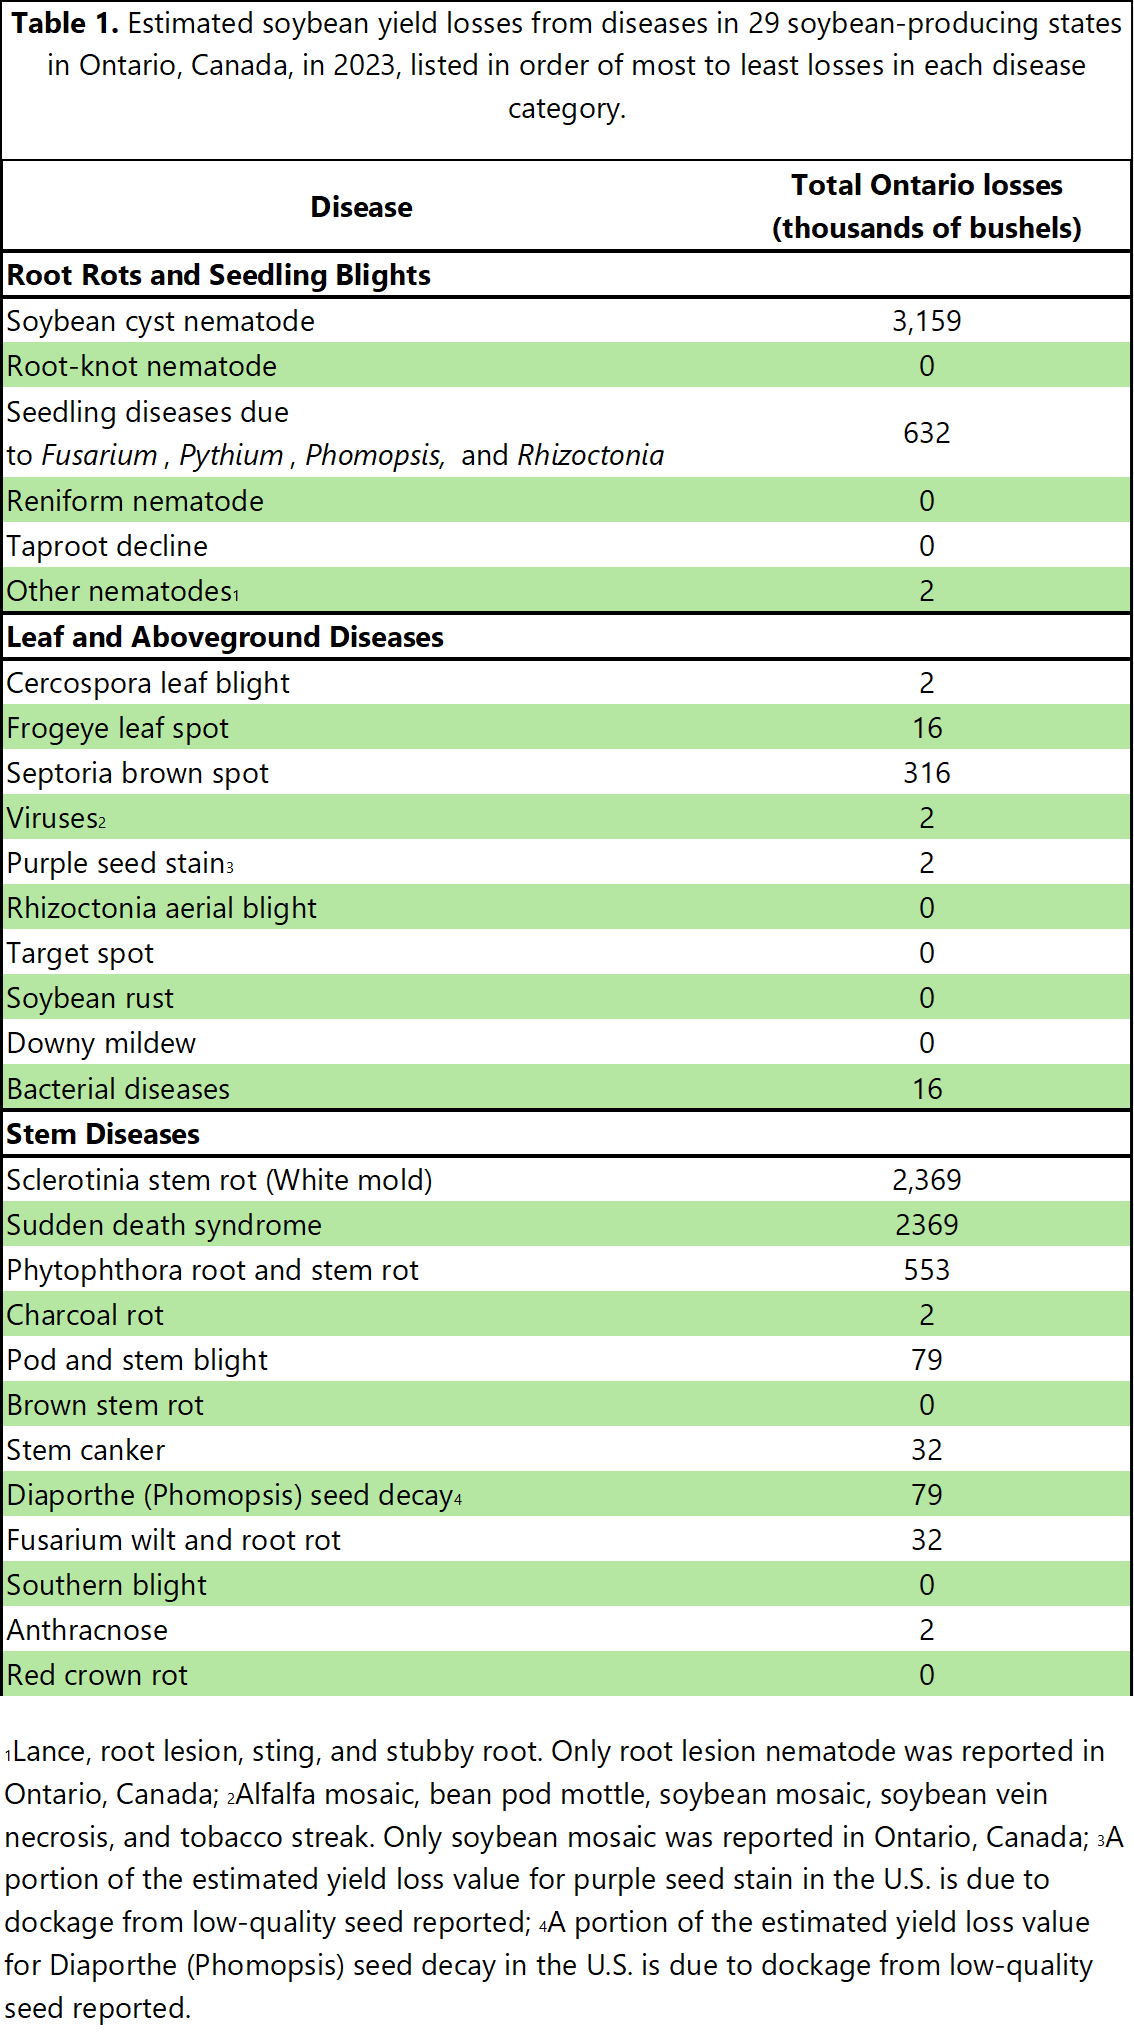
Last week we covered Phytophthora Root Rot, this week I will focus on Rhizoctonia. Rhizoctonia tends to have less of a yield impact than Phytophthora root rot. See chart below on the impact of the various soybean diseases. This data is from 2023 off the Crop Protection Network website.
2023 Disease Losses - From the Crop Protection Network
In all, an estimate of 4.8 percent of the potential soybean production (bushels/acre) in 2023 was lost due to disease from the 29 soybean-producing U.S. states, and 6.1 percent of the total soybean bushels in 2023 were estimated to be lost due to disease in Ontario, Canada. Table 1 provides yield loss estimates for the specific diseases throughout the soybean production system in the U.S. and Ontario, Canada, and Figure 3 compares the proportion of losses caused by major diseases. The 2023 estimated losses from soybean disease in the U.S. are the second lowest observed out of 28 years of available data, with only 2022 being lower. In Ontario, 2023 percent losses were slightly higher than in 2022, reversing an annual decline beginning after 2018.
Rhizoctonia Root Rot in Soybeans (JZ)
1. Is caused by the fungus Rhizoctonia solani.
2. Infected seedlings can have death occur both pre and post emergence. The lesions are sunken and remain firm and dry, with the root rot phase possibly persisting until the late vegetative/early reproductive growth stages. The plants may grow out of the root rot but usually remain stunted.
3. Conditions that favour the disease are cool, wet springs follow by hot and dry weather. The disease is more prevalent on light and sandy soils, with it more likely to appear on the slopes of fields (i.e. SWAT Zones 1-4).
4. Life cycle -> Surives on plant residue or in the soil as sclerotia. Infection occurs after seed is planted. Corn, alfalfa, dry beans and cereals can also be infected by this disease, meaning crop rotation is not effective in managing the disease.
5. Management to reduce the impact of this disease includes the use of effective fungicide seed treatments and minimizing herbicide stress, which can cause injury to the soybean roots.
Notes from: https://cropprotectionnetwork.org/encyclopedia/rhizoctonia-seedling-blight-and-root-rot-of-soybean
Corn
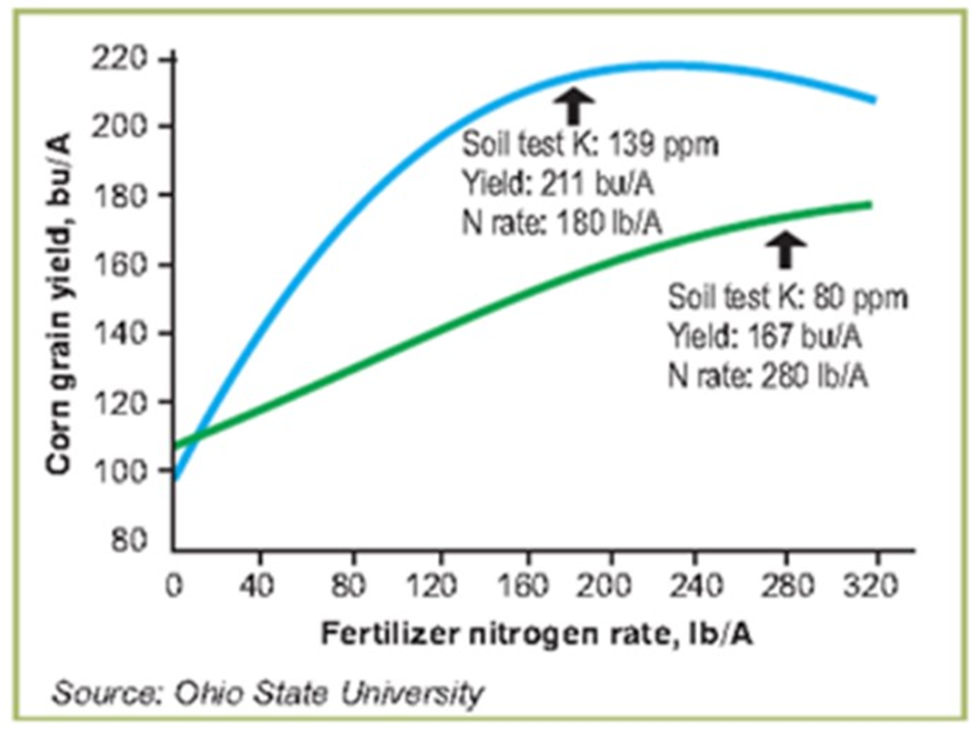
Question – I want to make better use of my nitrogen and get higher corn yields, what can I do management wise to help that?
Answer – If you have low potassium soil, fix it. Potassium helps to improve nitrogen efficiency in the plant. Even if you do not have low potassium soils, there is local research to suggest applying nitrogen in excessive amounts at once (C. Brown – OMAFRA) can inhibit potassium uptake, causing a yield reduction. Balanced crop fertility makes better use of nutrients and provides more yield response than just applying increasing higher N rates.
Forages
Forage Management Quick-Hitters – Joe Lawrence – Cornell (JZ)
1) Disc vs. Mower – Discbine can pick up more yield (due to lower cutting height), but it means you pick up more ash (reducing feed quality) and stress the grasses more.
2) With grasses – You will get more total yield for the season by raising the cutting height due to faster regrowth.
3) Avoid the Vacuum Effect – Which means the discbine picks up ash from the soil and incorporates it in the feed. Curved blades are worse than straight blades.
4) Stem Crimping – Is a requirement for dry hay. Use wide rows without crimping for rapid dry down for silage.
5) Grass Maturity – Once you see the head, the quality is dead.
6) Grass Quality 1.0 – Are less forgiving than alfalfa when it comes to crude protein, rapidly dropping closer to maturity.
7) Grass Quality 2.0 – There are bigger differences between species of grass than varieties of grasses when it comes to forage quality.
Fertility
From an article by Christine Brown OMAFA
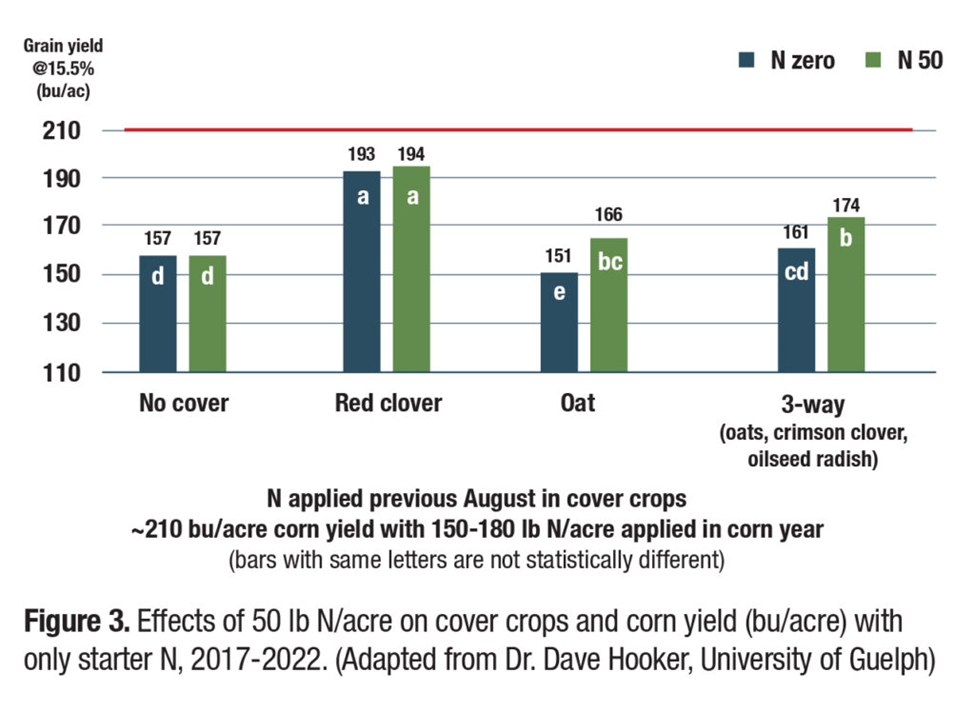
(Maybe we have not been giving red clover enough nitrogen credit. In this research red clover with 50 lbs N yielded 194 bu/ac. Red clover with no extra N yielded 193 bu/ac. Both treatments had 30 lbs N as a starter. PJL)
Red clover provides a reliable N supply to corn, but non-legume cover crops don’t because they don’t release N in sync with corn’s demand. Applying manure can result in slightly earlier and potentially higher – N release from cover crops, closing the gap in N supply and demand. For the past five seasons, Dr. Dave Hooker at the University of Guelph has evaluated how corn yield is affected by applying 50 lb N/acre in August to different cover crops. The only additional N was applied to corn as starter fertilizer on the planter in a 2”X 2” band (~30 lb N/acre). The combination of applying 50 lb N/acre to a cover crop (established the previous year) significantly increased corn yield compared to not planting a cover crop (Figure 3). Red clover is still the most valuable cover crop, but the combination of establishing another cover crop and applying 50 lb N/acre (from manure or a nitrogen fertilizer) is a good alternative for those that struggle to establish red clover.
The four types of fertilizer recommendations when it comes to phosphate and potassium (JZ)
1. Crop Response – these types of recommendations will be made based on OMAFA crop response recommendations and will require a soil test.
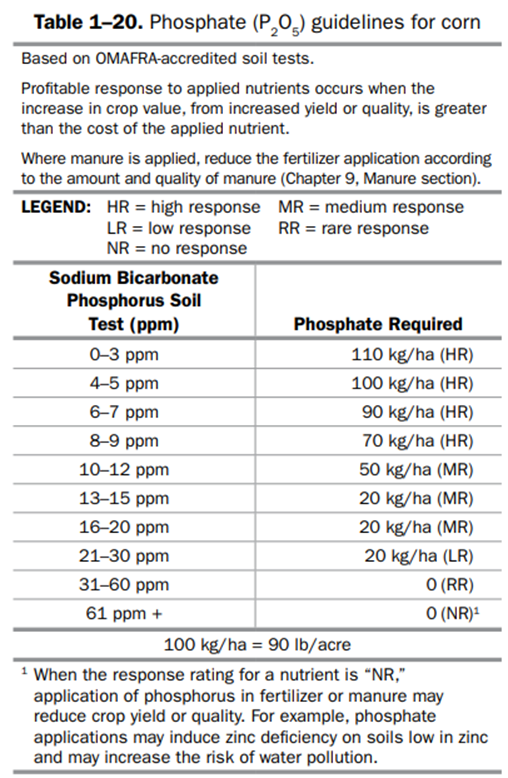
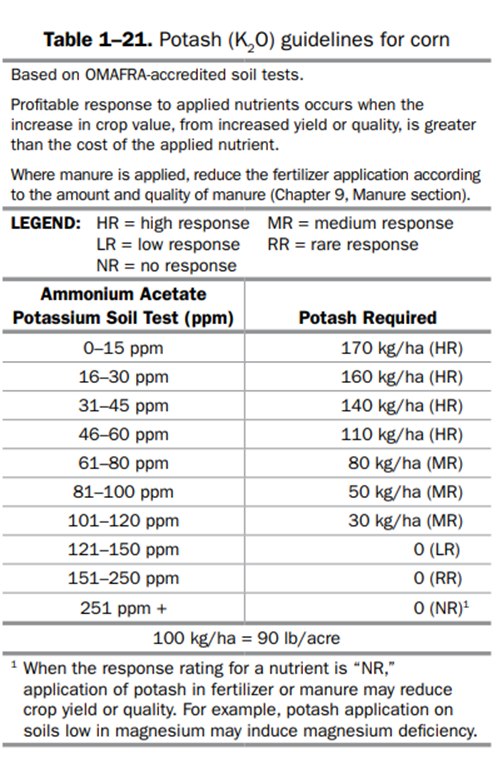
Phosphorus and Potassium Crop Response Recommendations for Corn - Publication 811 - Agronomy Guide to Field Crops
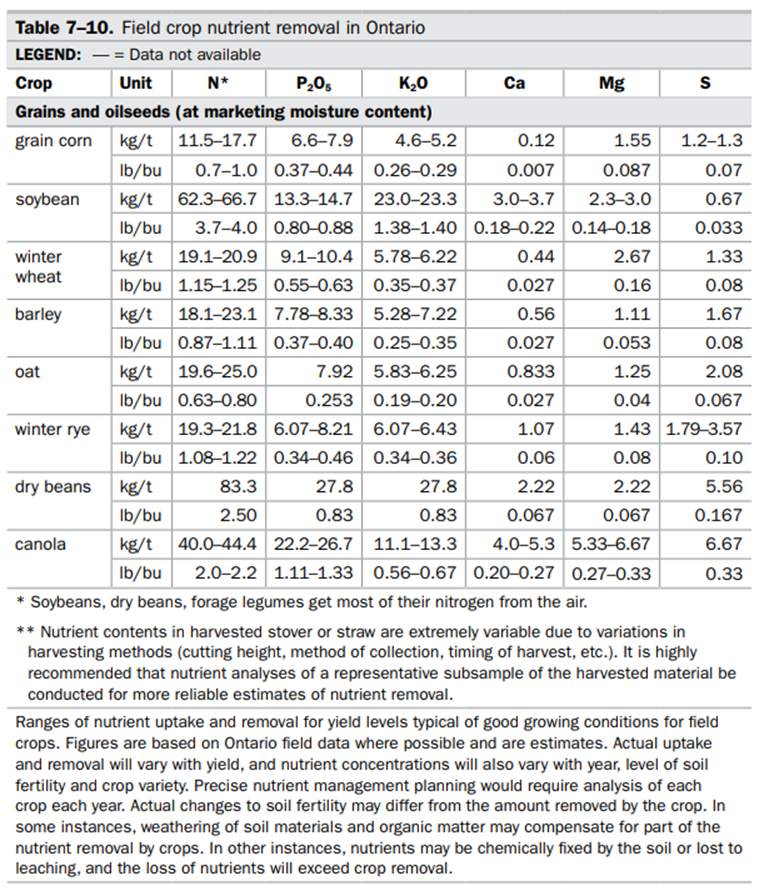
1. Crop Removal – take your yield by field or yield map and multiply it by the removal rate for phosphate or potash for the crop in question. See suggested OMAFA removal rates by crop below.
3. Build and Maintain – you apply over and above crop removal to try and build your soil test levels over the whole field or parts of the field. This is typically done over a set period of time, like 3 or 5 years to reach the targeted soil test value.
4. Mine the field – I do not typically promote this as a practice but you apply less than crop removal rates. It is a fit for fields that have extensive manure history or have had strong fertilizer applications in the past and continue to have a strong soil test.
How much nitrogen should I put in my crop plan with the current price of corn? (JZ)
With what looks like a tighter crop budget for the 2025 season, I feel that pulling out the Ontario Corn Nitrogen Calculator is a good starting point when making corn nitrogen recommendations.
Some will point out that the recommendations are getting abit long in the tooth, and I do think they are valid in making that criticism.
Where the tool offers the most value is determining credits or adjustments for previous crops, manure applications, and if you are side dressing. If you try and break apart how the calculations are made in the tool, the majority of the rate is determined by your expected corn yield.
So where does the tool get it wrong the most? I would suggest it is because we input the wrong expected yield! Hard to know that in the first place. Right? Perhaps we should be running a few rate scenarios instead of punching in one rate and see how wide of a spread we get on the recommended N rate.
I have run many scenarios for my local area on Harriston loams. At the end of the day, you should likely be targeting 0.8 lbs. N per bushel of expected yield on these soils when following a cereal crop (if applying all of the N up front). This would mean about 130 lbs. N/ac at 160 bushels, 160 lbs. N/ac at 200 bushels/ac and 190 lbs. N/ac at 240 bushels.
What can you do with this information? Maybe you build a crop plan to start with 180-200 bushels given the yields last number of years and adjust in-season if required with a top up if corn is planted in a timely manner with strong populations and consistent rains… food for thought.
Q - How much Nitrogen should I plan on having up front if I am planning on side-dressing/top-dressing my corn? (JZ)
A – I like to see at least 100 units of N applied up front between the planter and the spring broadcast. This allows some wiggle room on timing the in-crop application and reduces the volume you need to apply later in the season. Could you get away with applying less up front? Yes, but plan on having to go back in sooner than later and remember that just because you applied the nitrogen does not mean the plant can immediately take it up!
See my latest video with Real Agriculture’s Soil School with Bernard Tobin (JZ)
Business Matters
Q – What are your thoughts on replacing some of my branded herbicides with generic products? (JZ)
A – Generic can mean different things to different people. Usually, it means the active ingredient is off patent, and the pricing usually reflects that relative to products still under patent. Where things get interesting is in the inert ingredients that help the active ingredients work. Not all formulations are the same within the generic market, and some products end up being much more effective than their counterparts of the same active.
Likely the best example is glyphosate. Sometimes you do get what you pay for, and the cheaper generic glyphosates tend to lack enough surfactant, especially when tank mixing with other herbicides to help control glyphosate resistant weeds. The cheaper generic simply doesn’t have enough surfactant if surfactant is required to activate the tank mix partner, and you end up with less than acceptable weed control.
So, what does one do? Poor product performance is unacceptable at any price point, especially for post emerge herbicide applications where a rescue treatment is extremely time sensitive. If you are buying off-patent product, ideally use one with local technical support that has also completed R&D to ensure adequate performance under your farming conditions.
"Not my monkeys, not my circus."
-Polish Proverb